
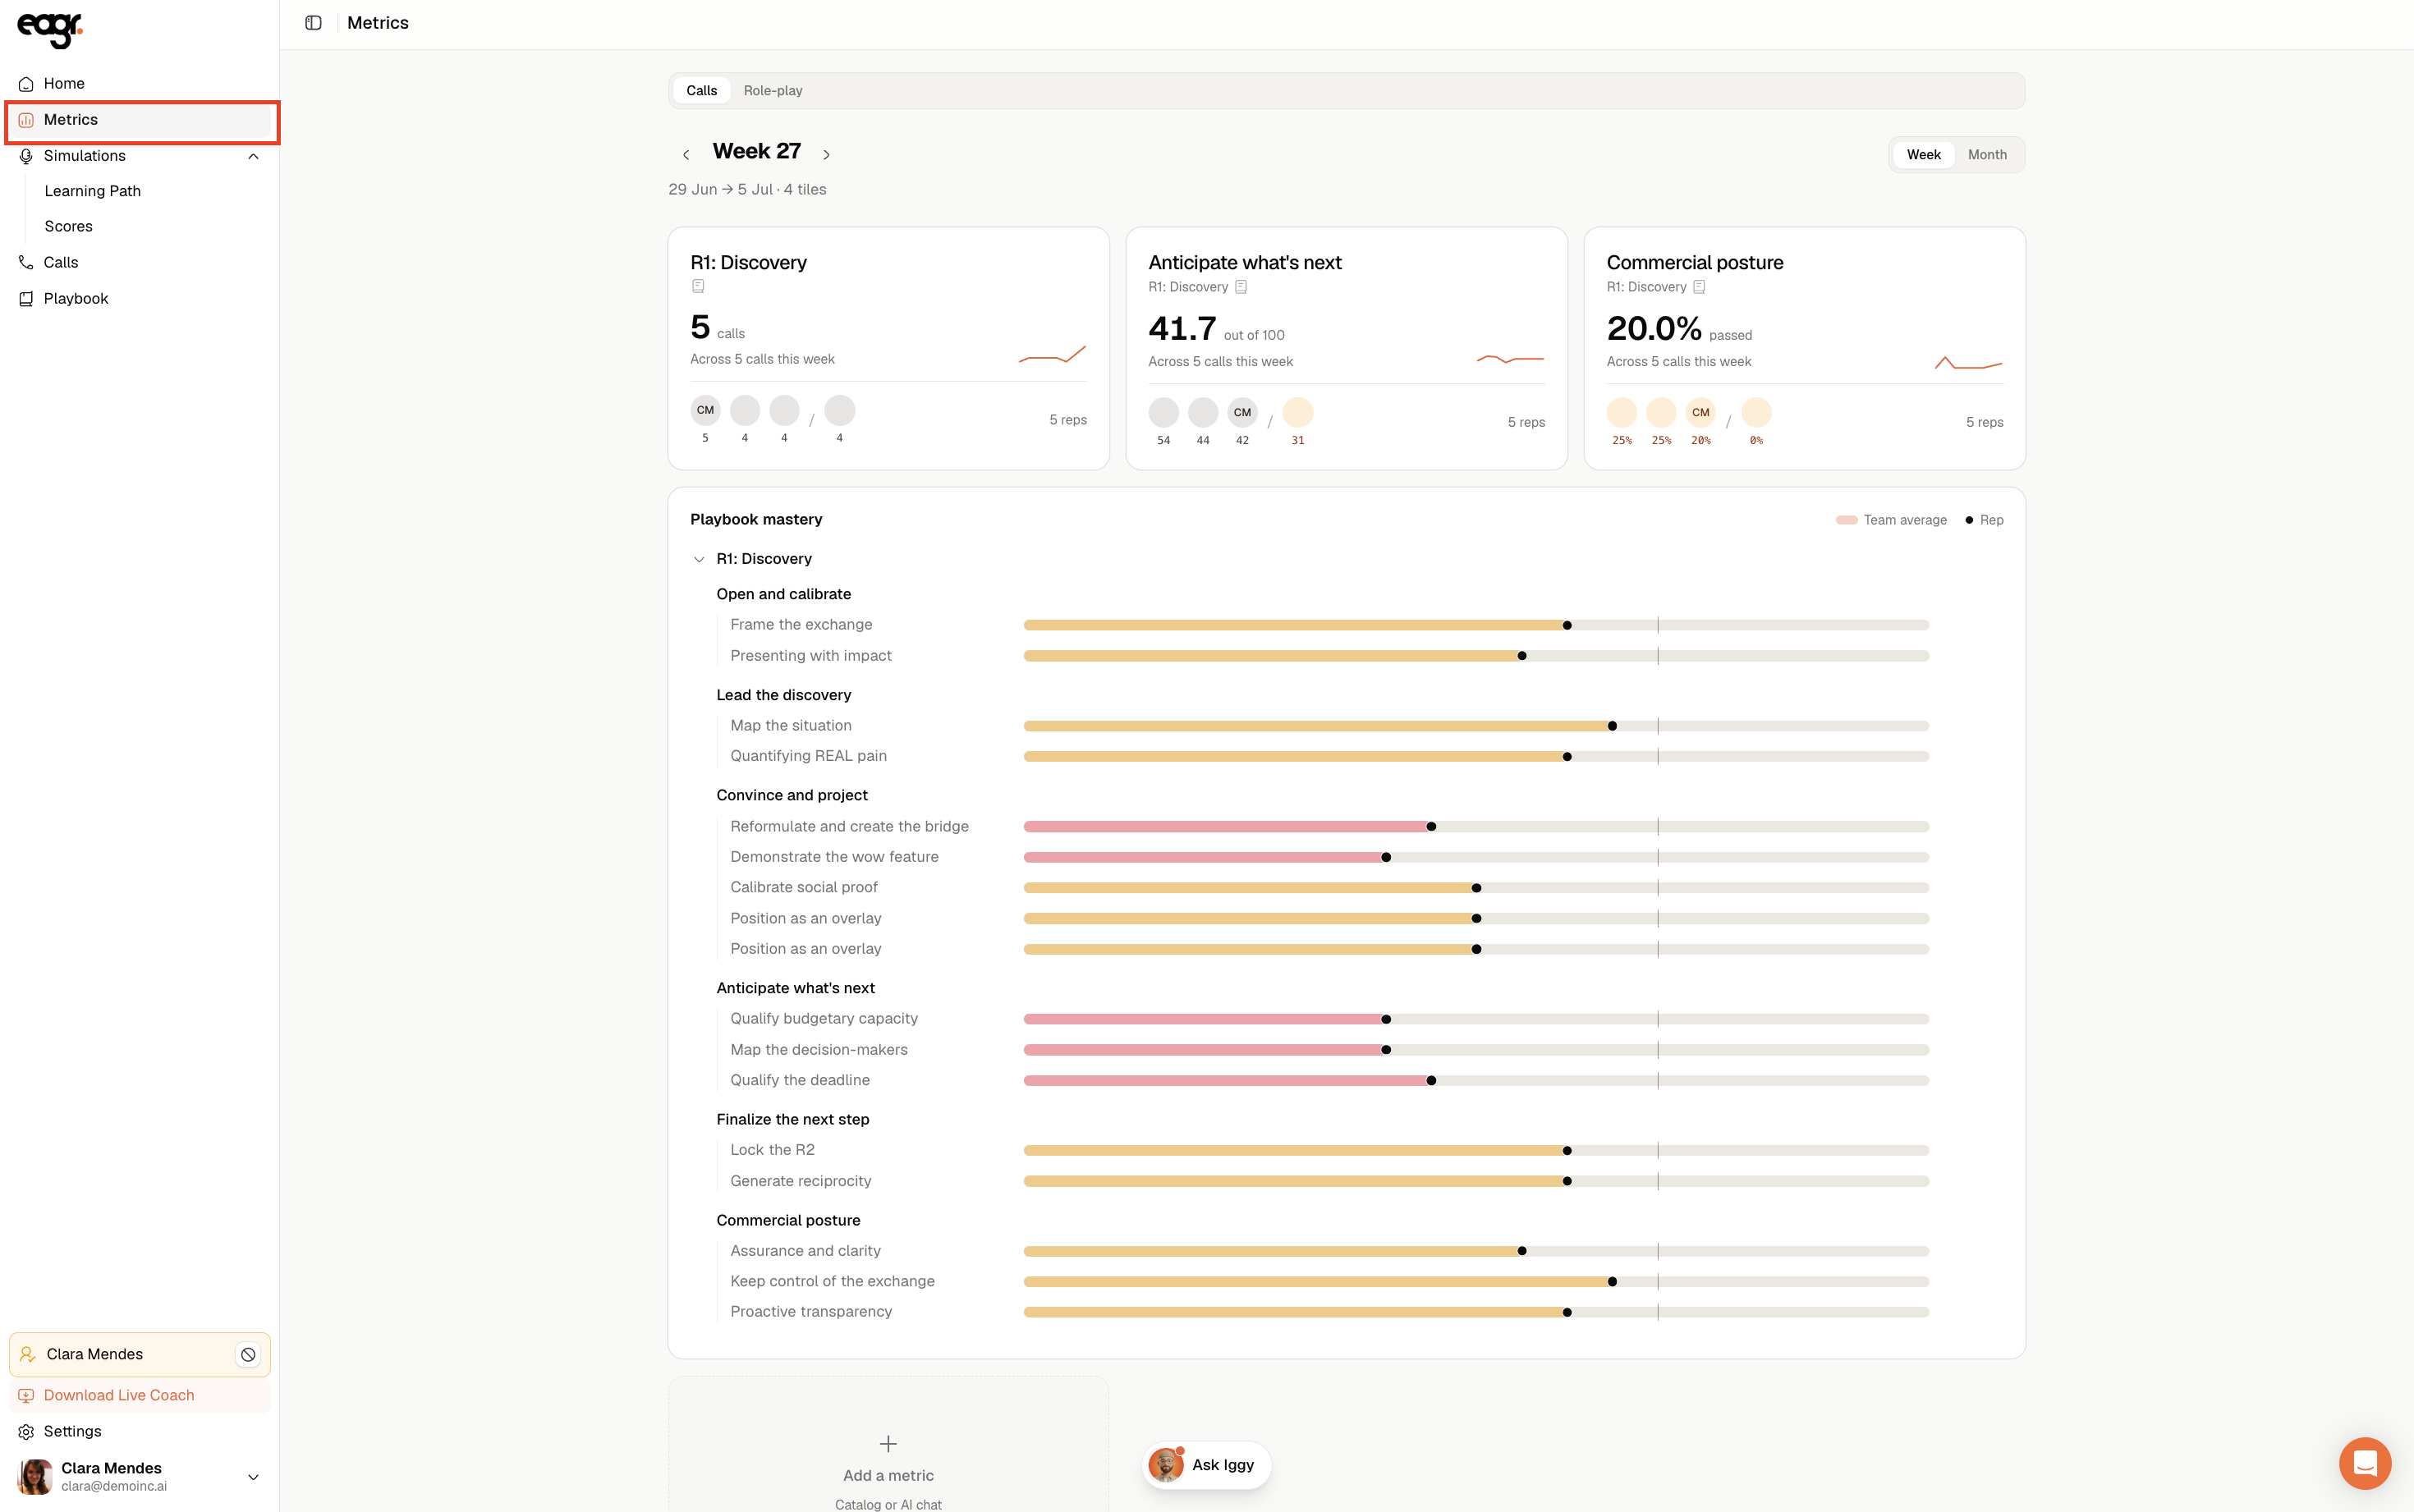
The Metrics menu is your progress dashboard. Unlike the other pages, it's up to you to build it: you pick the indicators that matter to you.
Metrics needs activity before it can show anything. If you haven't run any simulation yet and no call has been imported, it's normal for the page to be empty.
Calls or Role-play: two tabs
At the top of the page, two tabs separate your two types of data:
- Calls: your metrics from your analyzed calls.
- Role-play: your metrics from your simulations.
Setting up your dashboard
The page is configurable. You choose which indicators and charts to display, for example:
- how your score evolves across your calls and training,
- your progress competency by competency (the ones from your playbook),
- your call volume and training over a period.
Keep the indicators that match what you want to work on. You can always change them later.
To understand how a score is computed: How Eagr scores your calls and simulations.
Add a metric
Click + Add a metric at the bottom of the page. There are three ways to build your tile.
1. From a segment, a skill or a technique. In the Playbook analysis tab, search or pick the item to track.
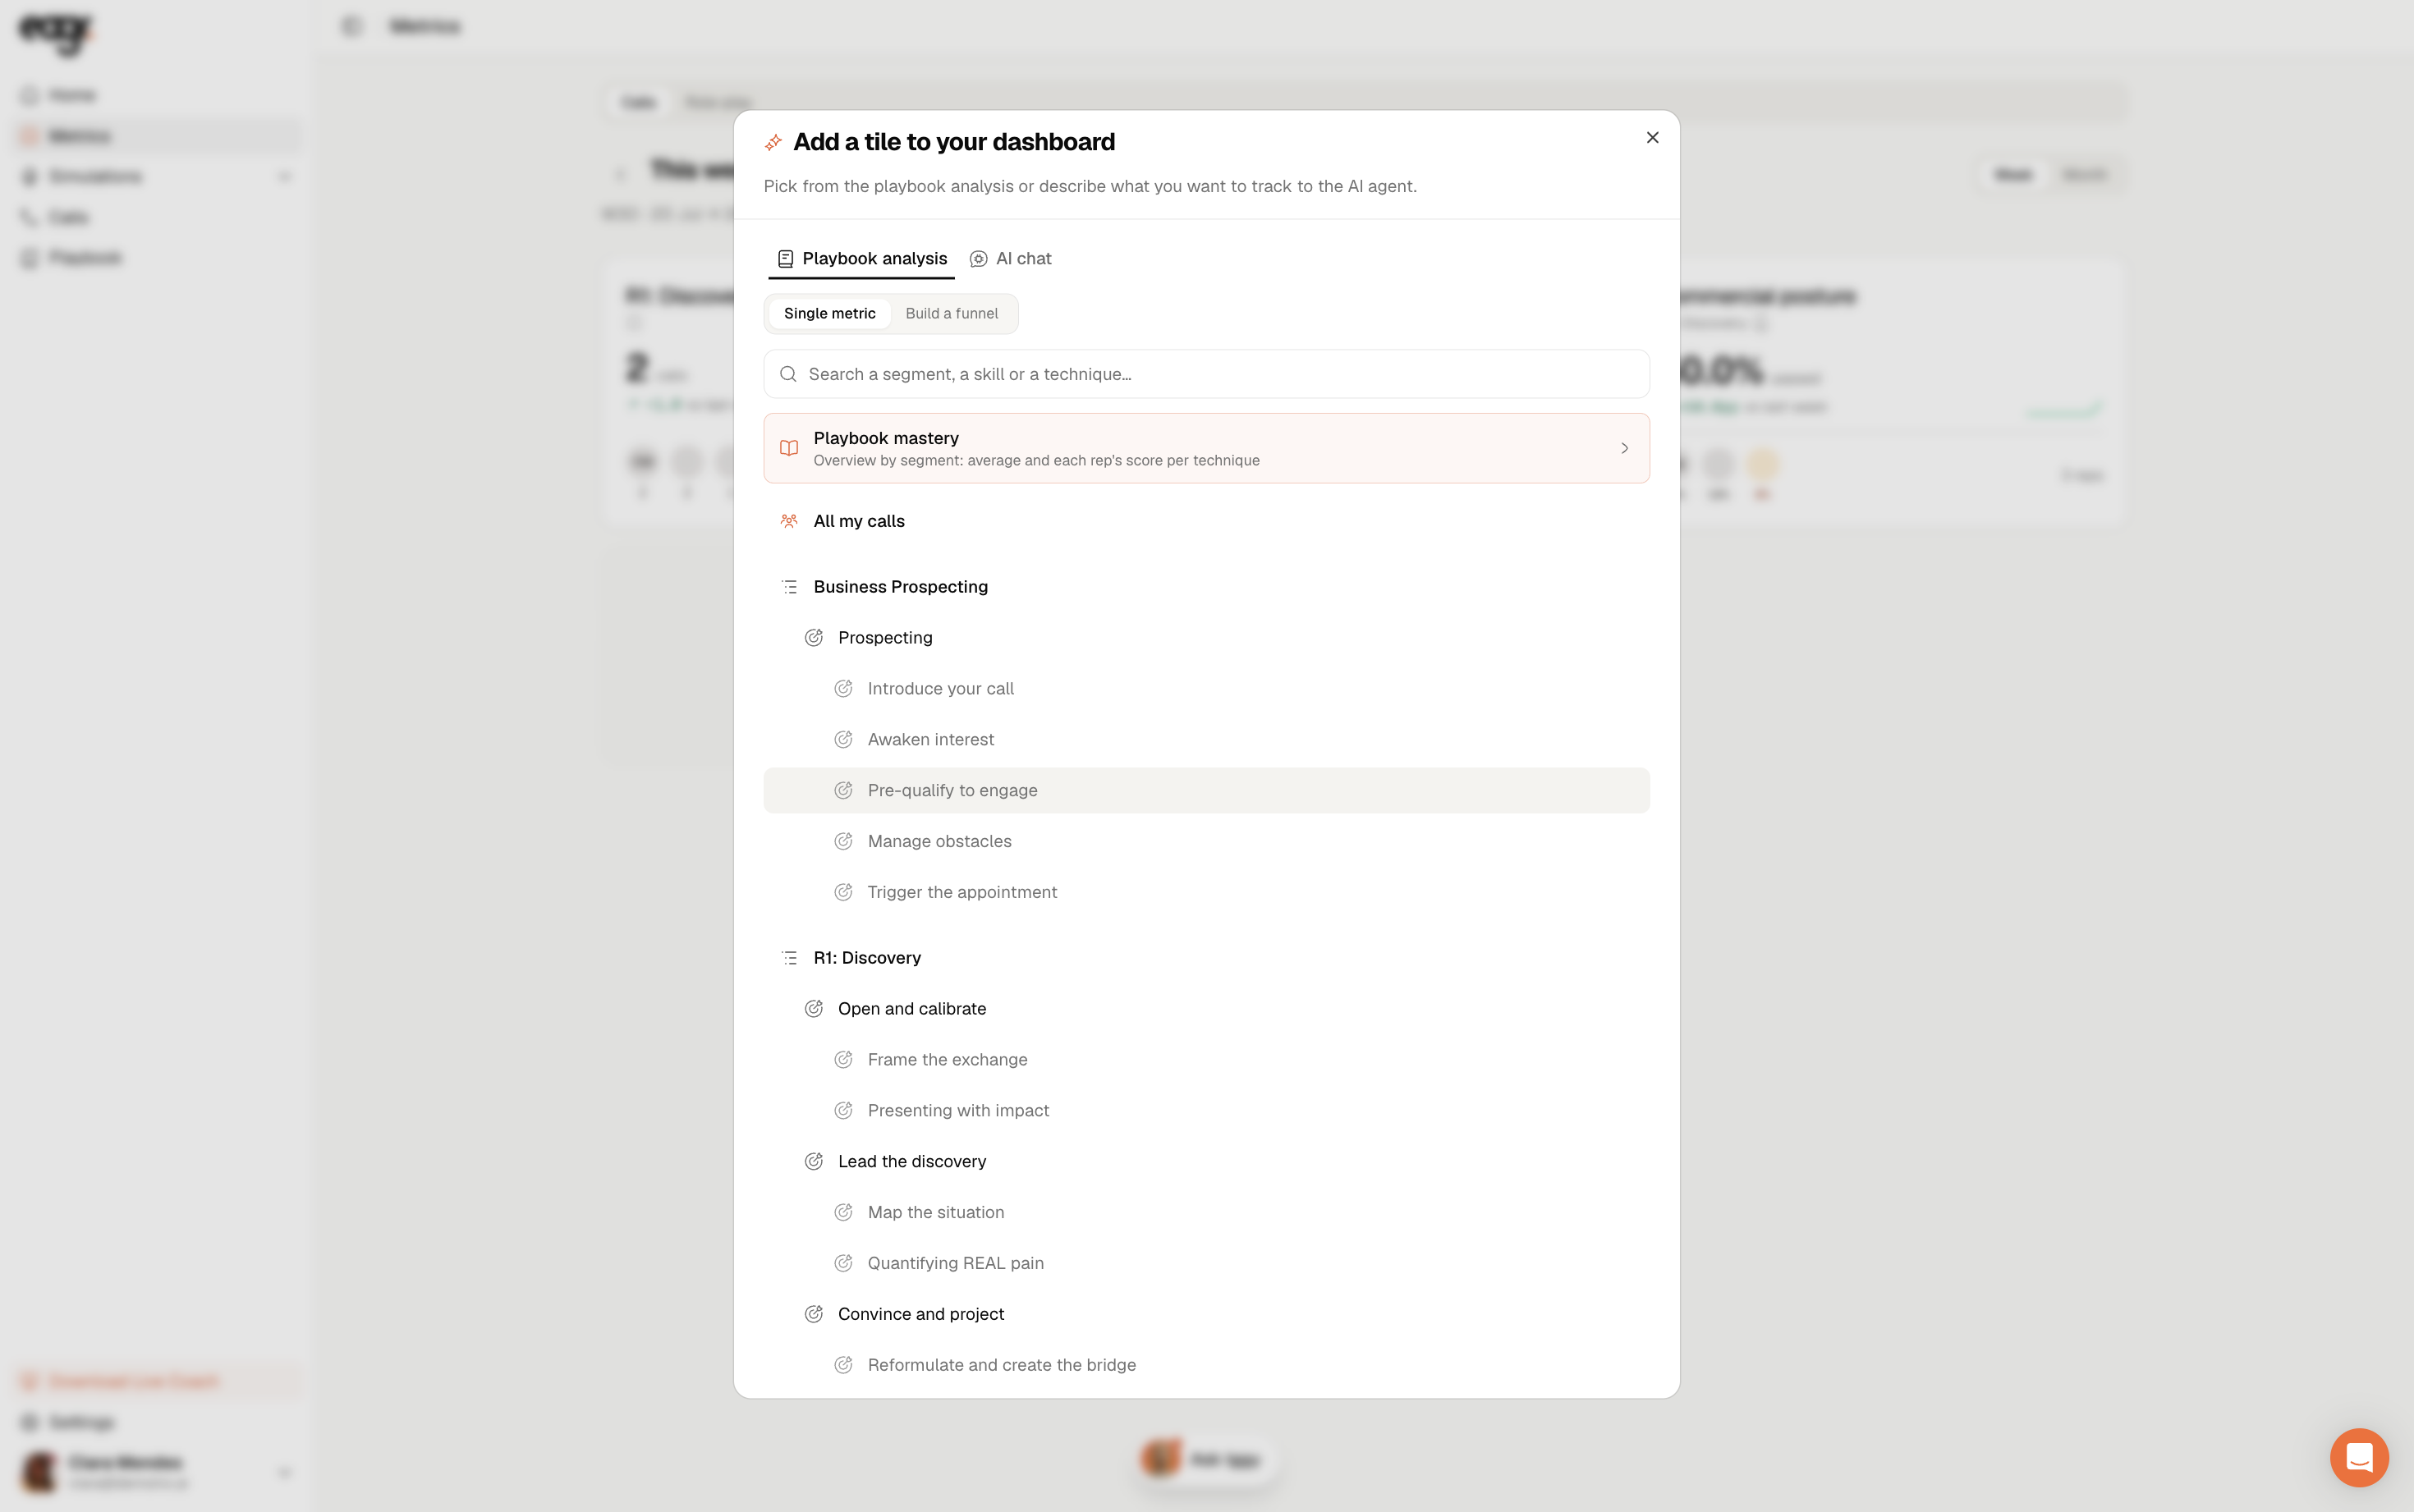
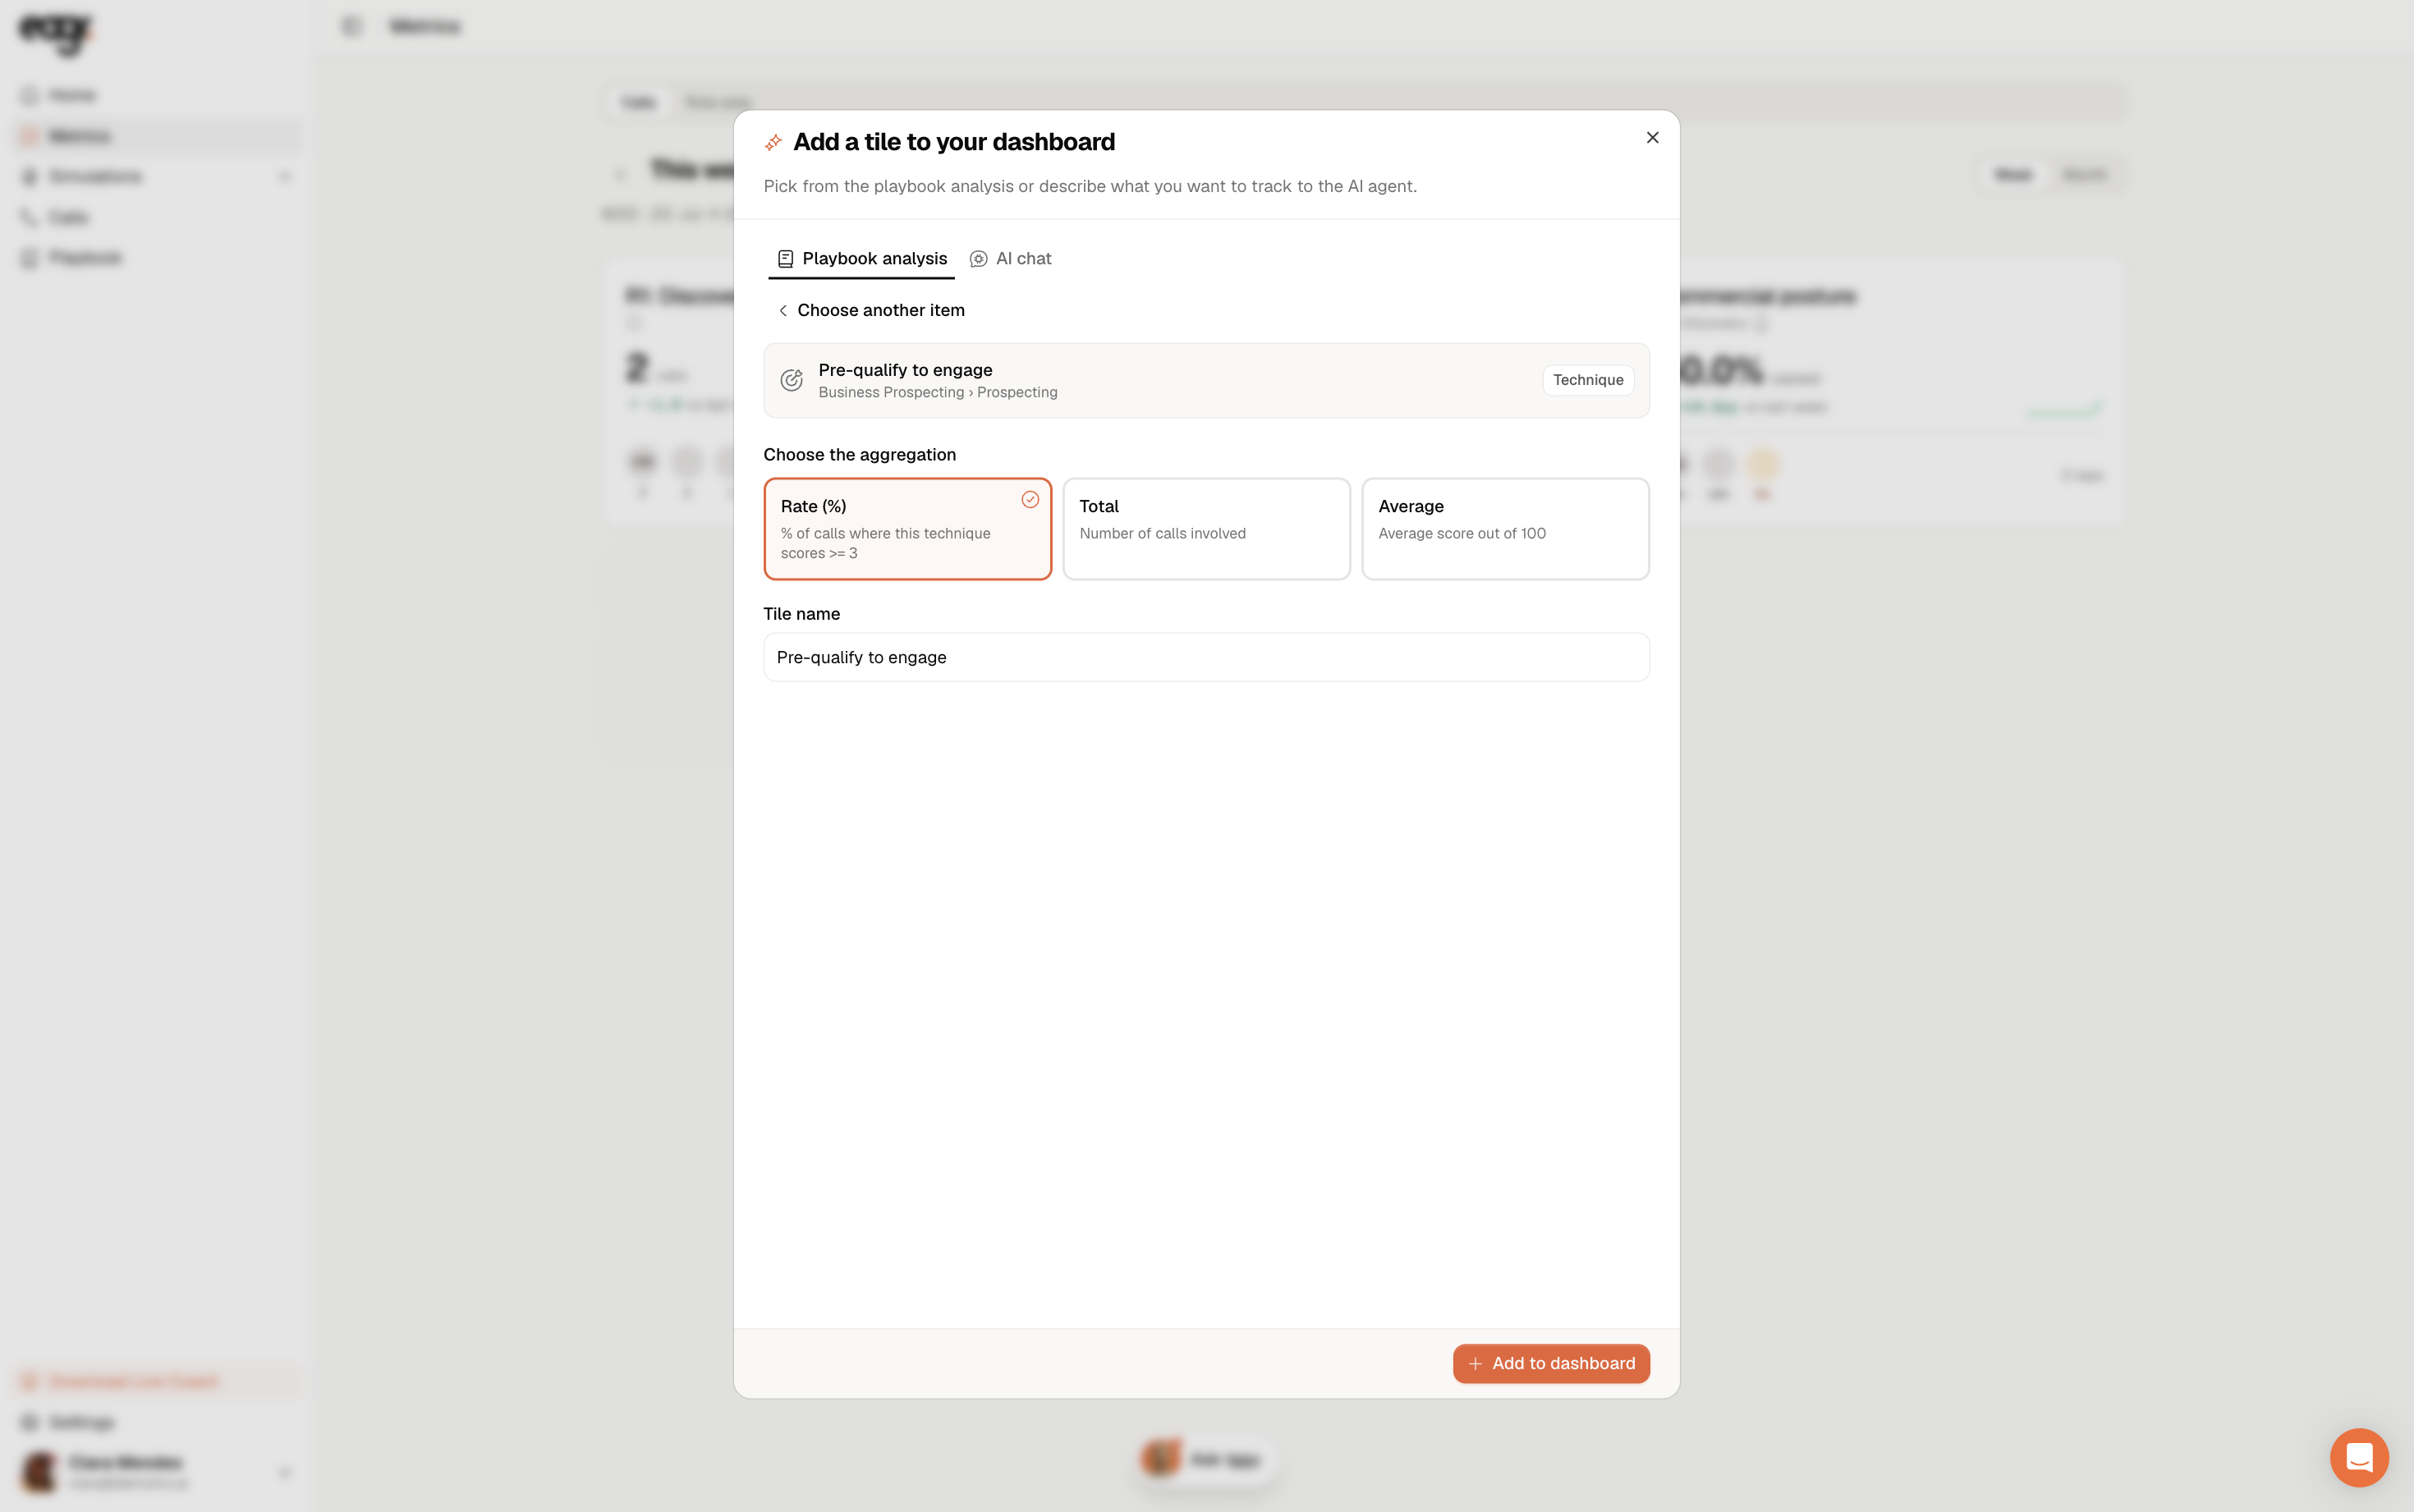
Then choose the aggregation:
- Rate (%): the share of calls where this technique is mastered, meaning a score of 3 or more;
- Total: the number of calls involved;
- Average: the average score out of 100.
Name the tile, then click Add to dashboard.
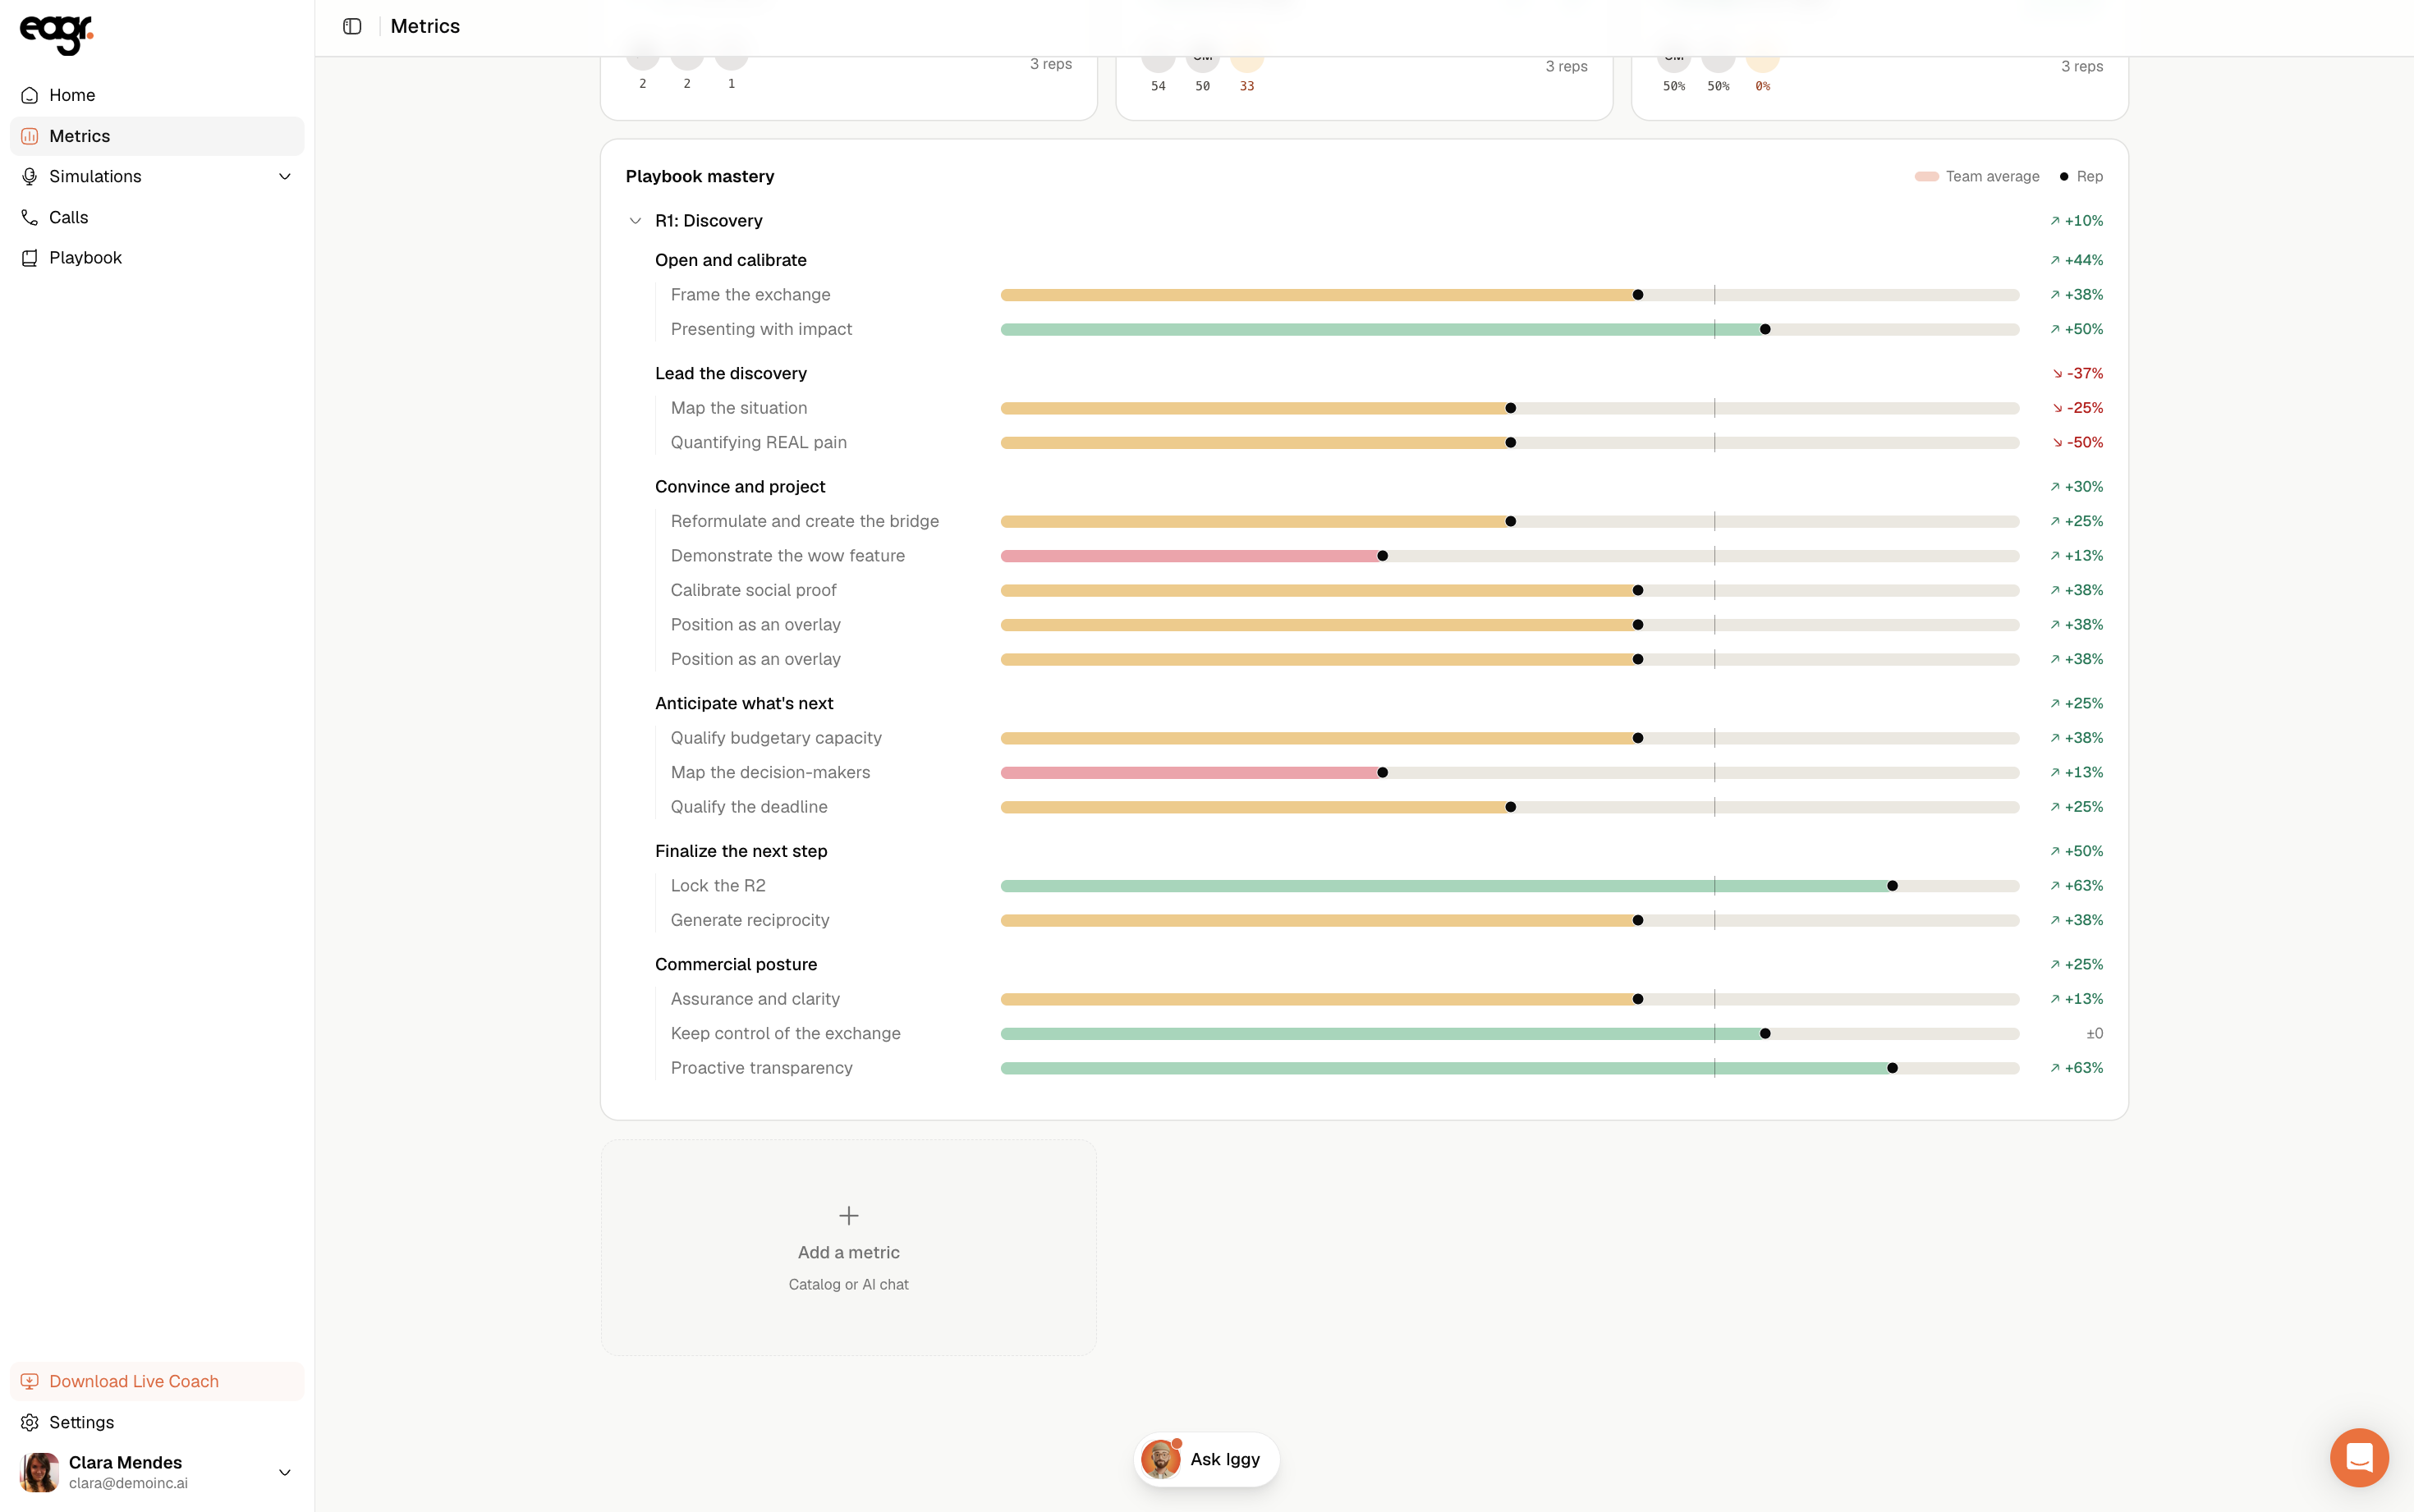
2. Playbook mastery. Pick Playbook mastery to see, segment by segment, where you stand on each technique: your average and, if you're a manager, each rep's score.
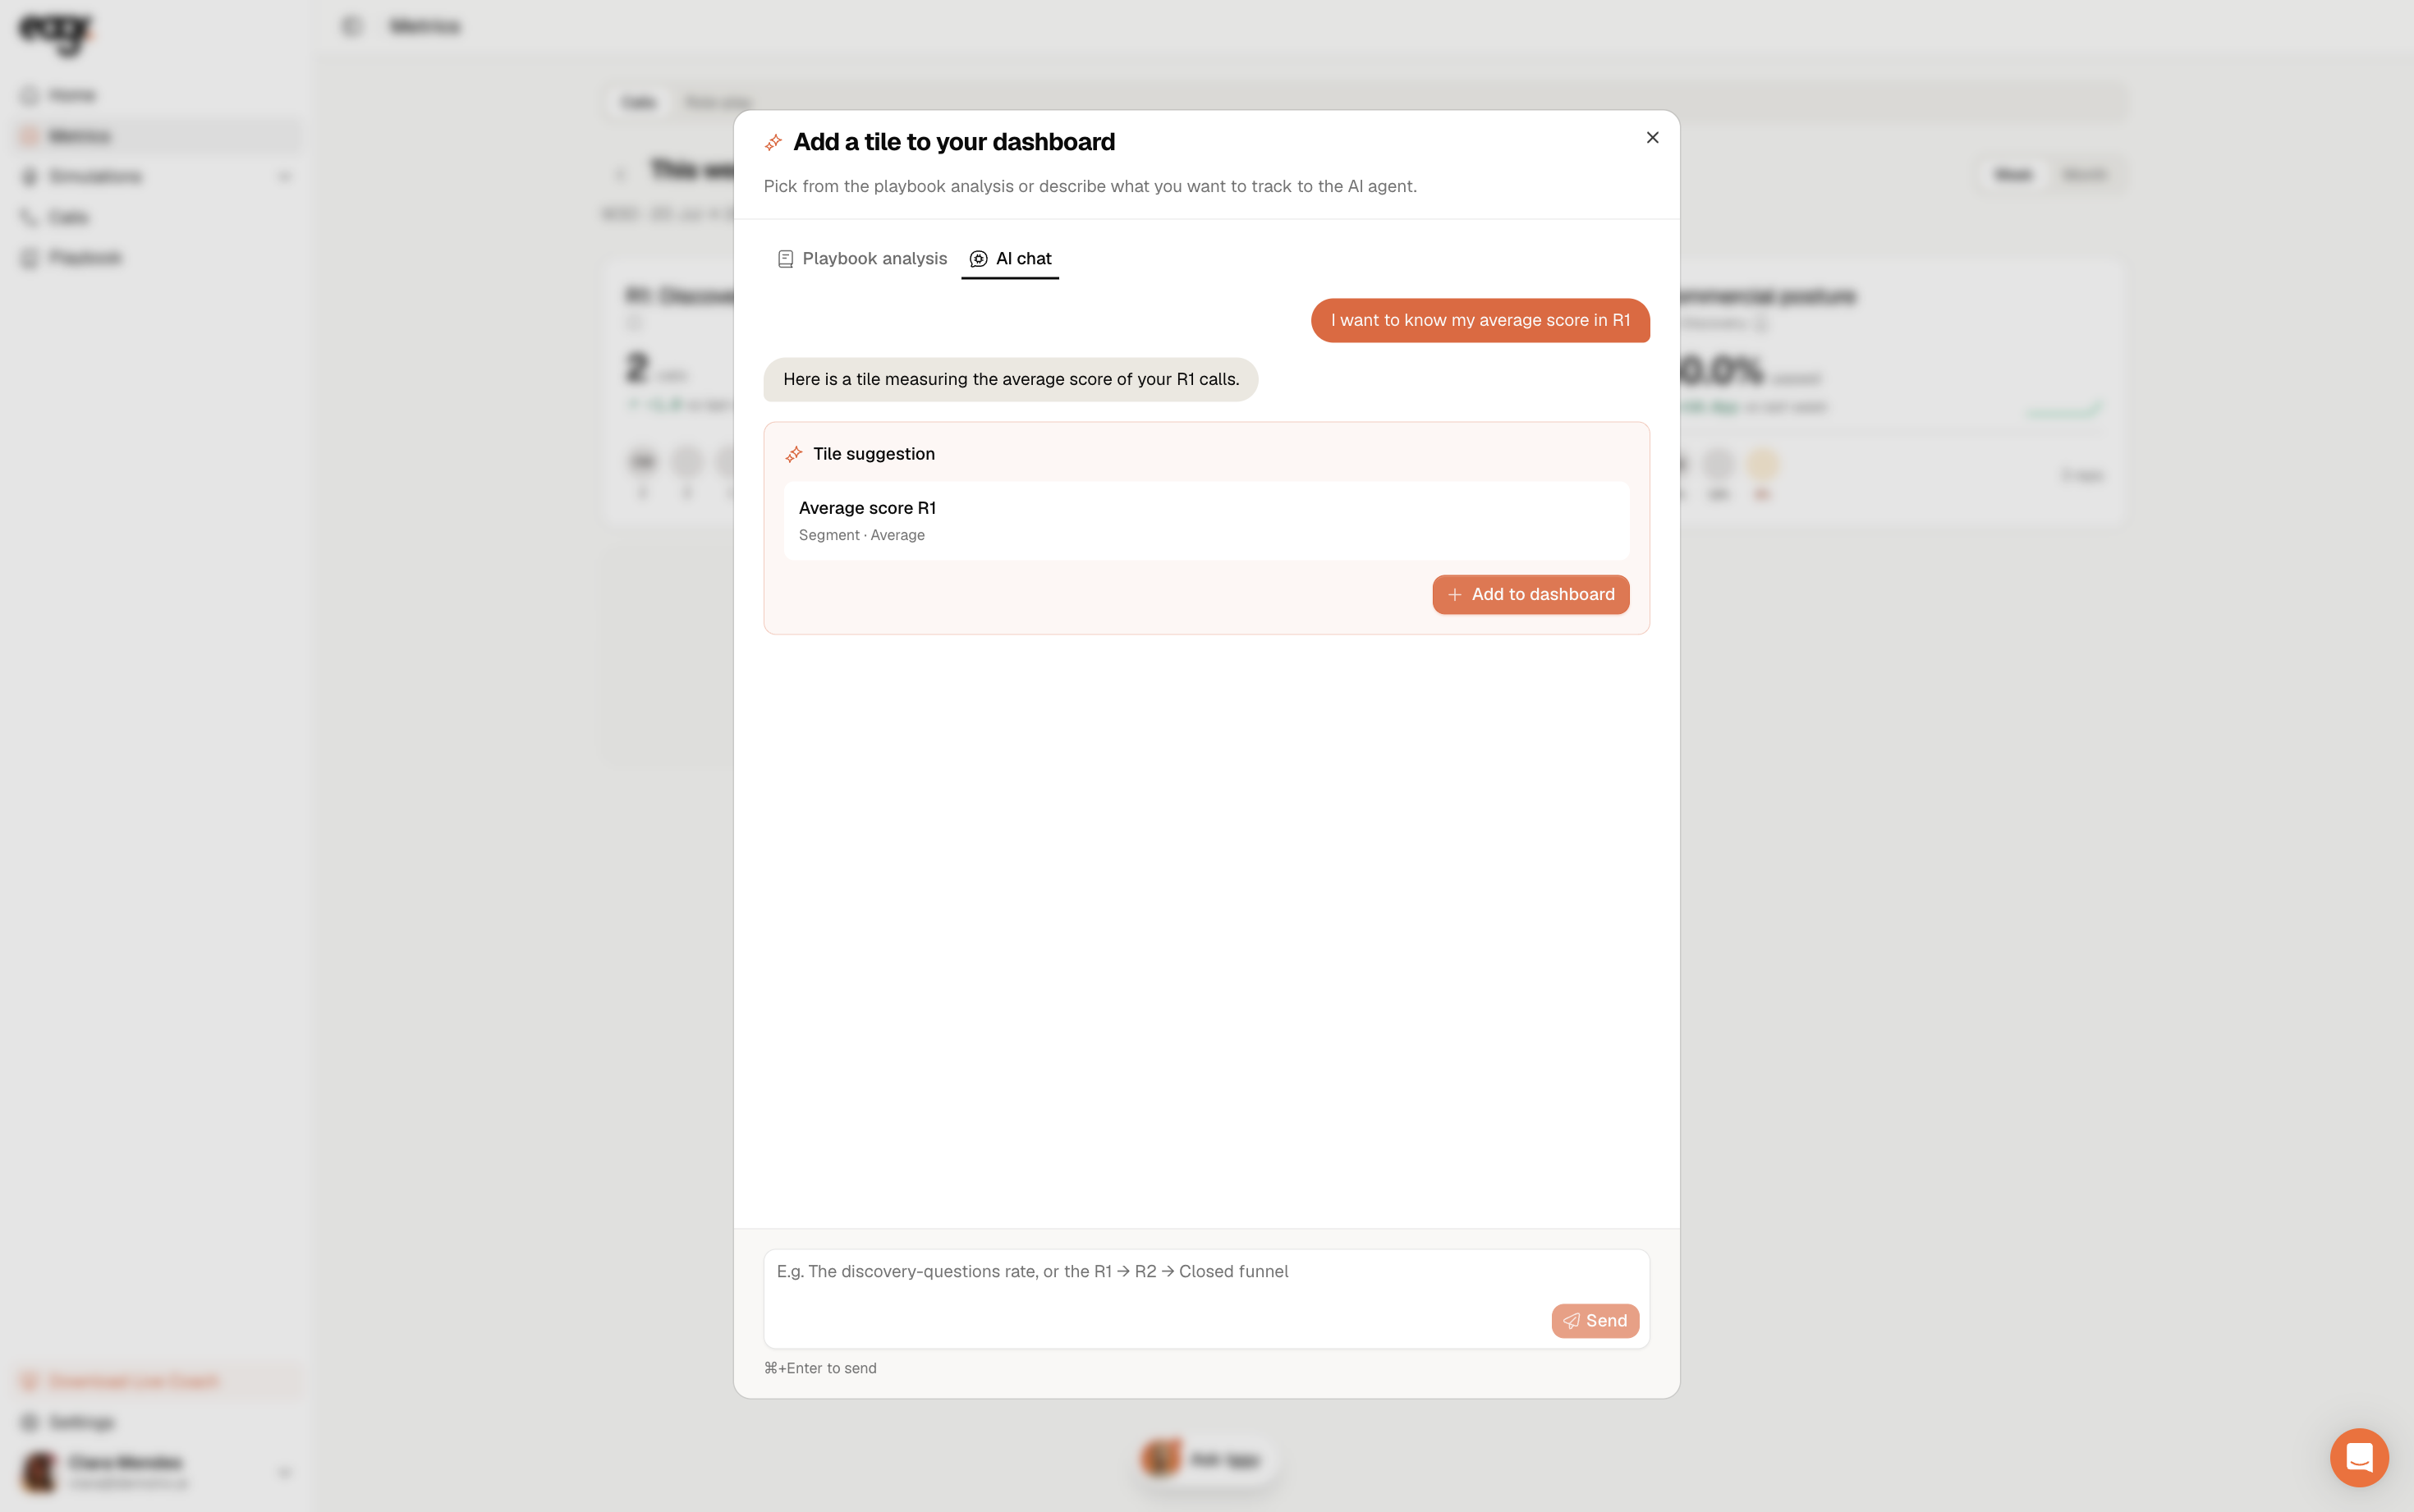
3. By chatting with the AI. In the AI chat tab, describe what you want to track (for example "my average on R1 calls"). The AI proposes a ready-to-add tile.
If you're a manager: your team and you
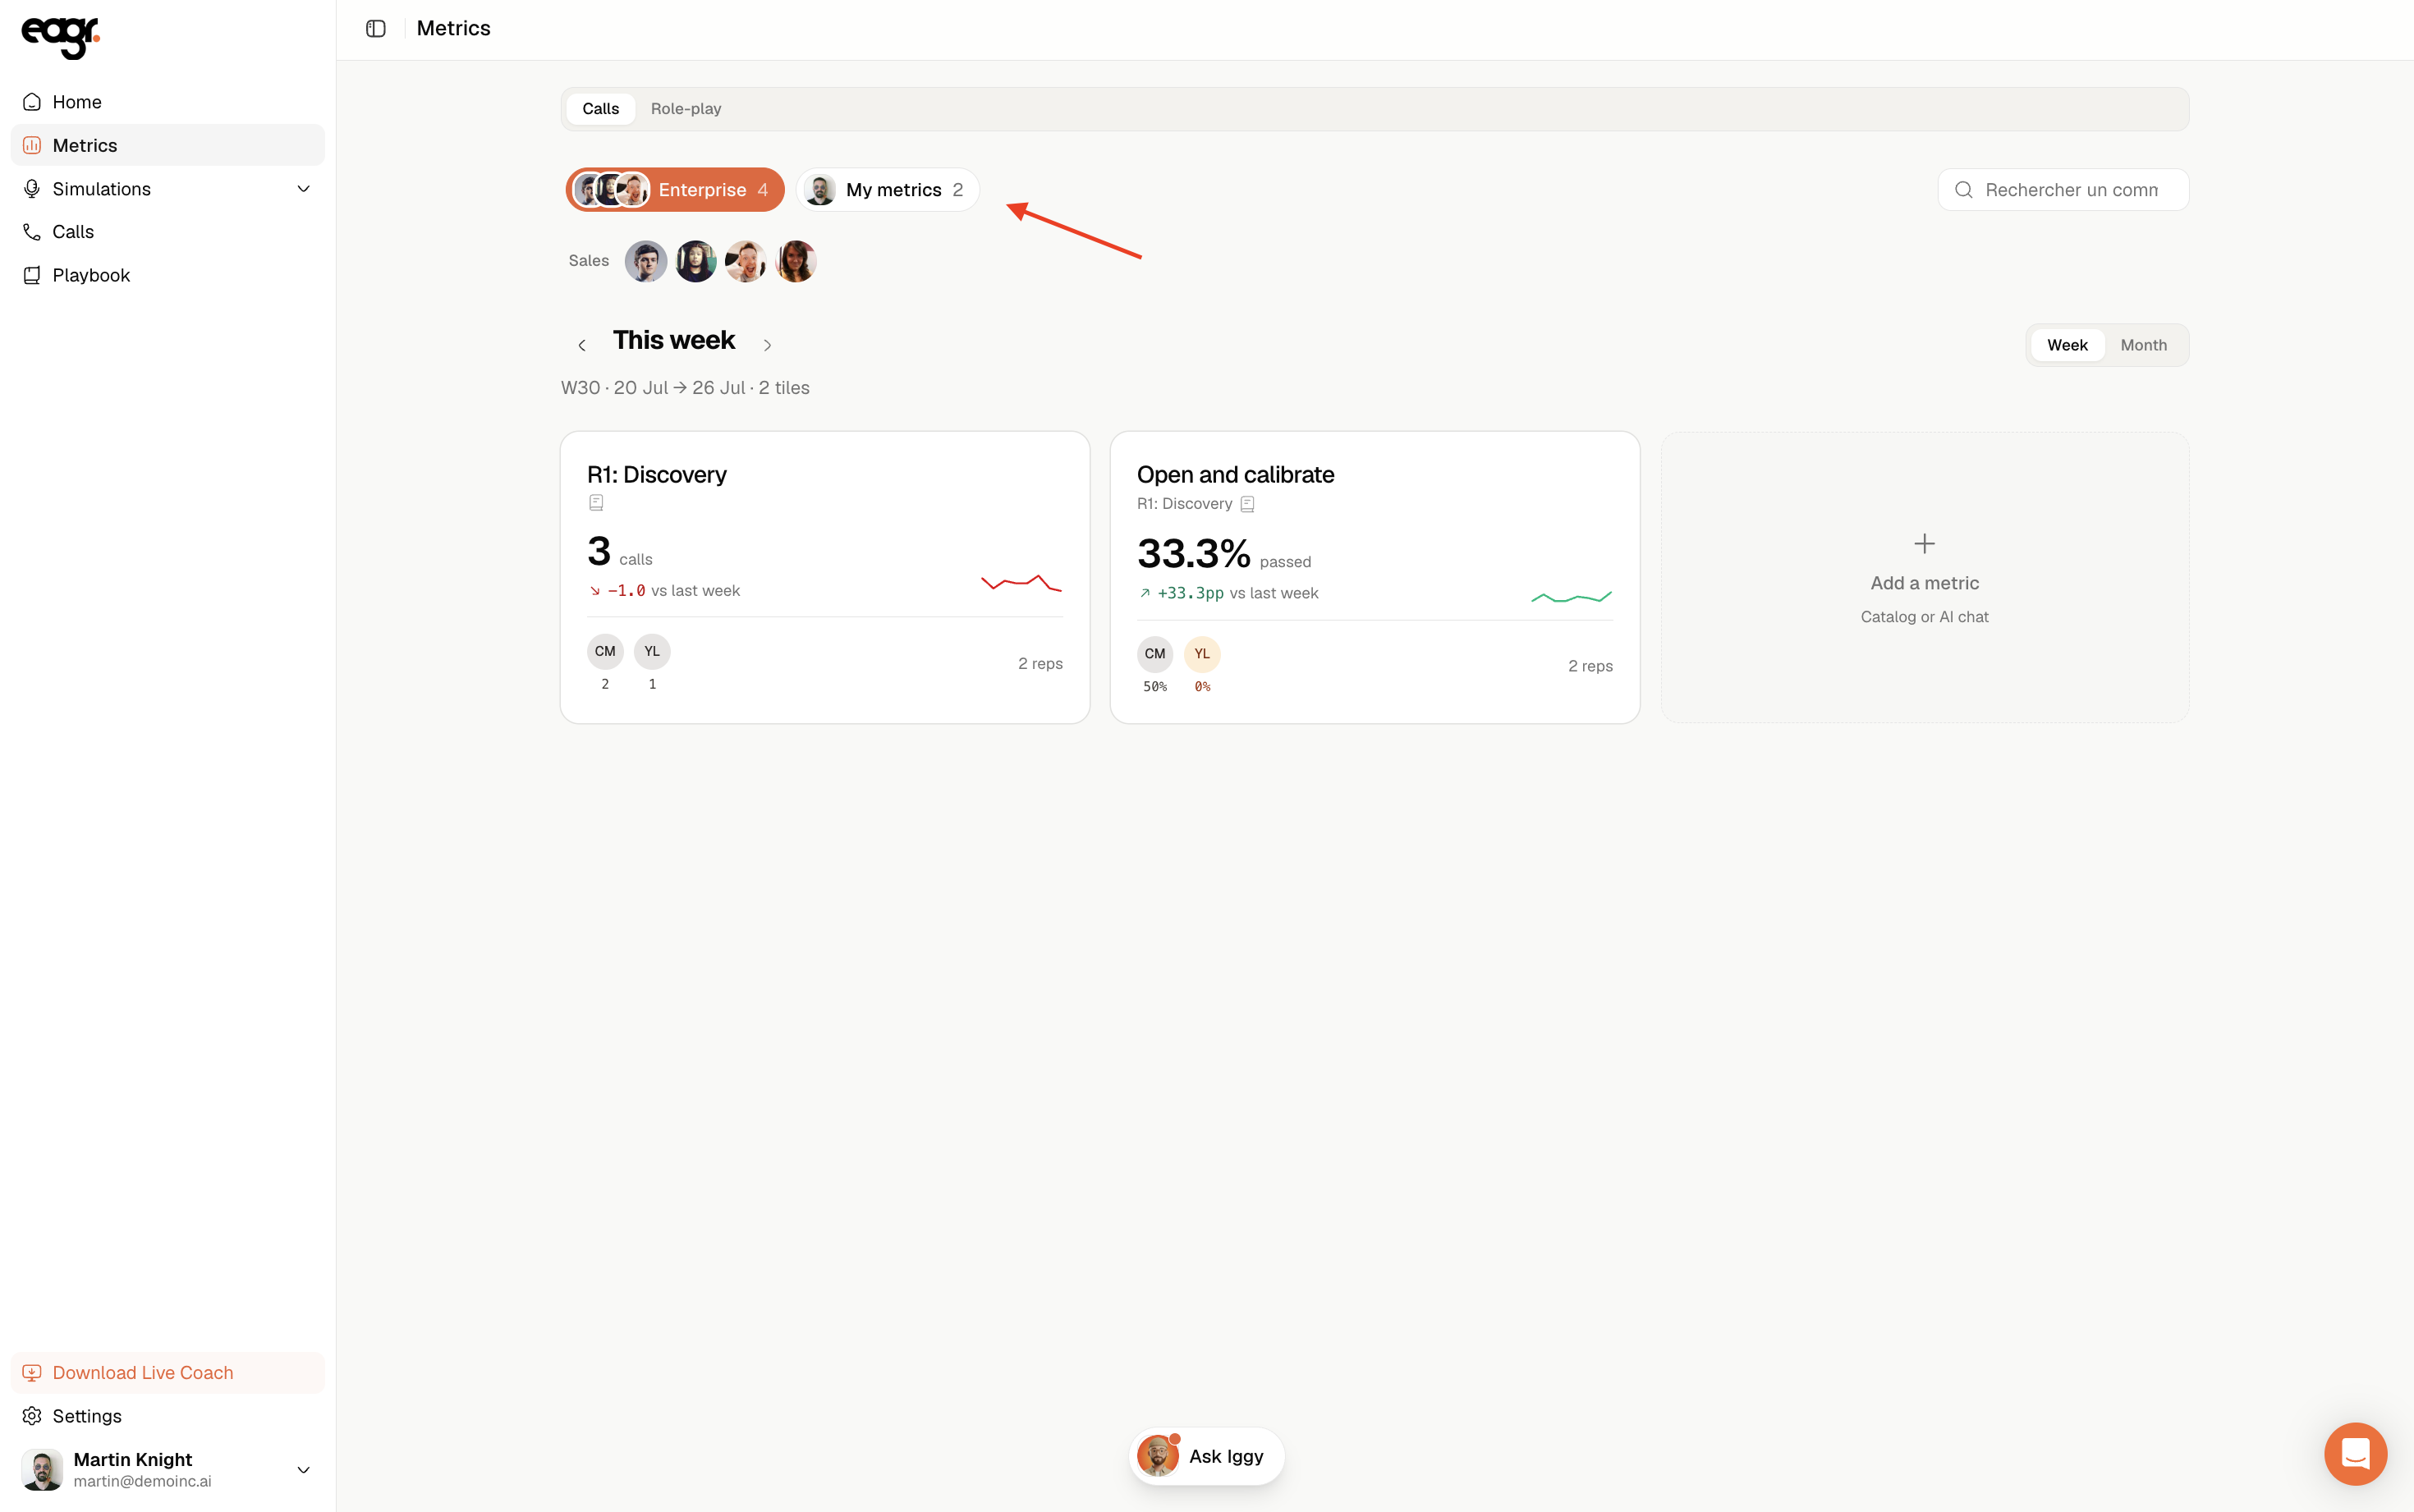
If people are attached below you, you're a Manager (see Understanding roles). By default, the page shows your team's metrics. You can:
- filter to one person by clicking their avatar in the list of sales reps,
- switch to your own metrics with the My metrics tab (it appears as soon as you record calls or run simulations).
Check your metrics once a week rather than after every call: trends are far more useful than a single score.